


반응형
머신 러닝 분류
- 지도학습
- 회귀(regression) - 수치형 자료(대소 비교가능)
- 분류(classification) - 범주형 자료
- 비지도 학습
- 강화학습
1. 단순 선형회귀 (Simple linear regression)
- 종속 변수 y와 독립 변수 x 사이의 선형 관계를 파악하고 이를 예측에 활용하는 방법
예시) 기온(x) 아이스크림 판매량(y) => 필요한 아이스크림 재료의 양을 예측 가능해짐 - 독립 변수 x와 선형 변수 y 사이의 관계식을 모델이라고 함.(학습 모델)
- y = Wx + b
상수인 W와 b를 찾는것이 학습 목표 - 현실 세계에서는 두 변수가 _선형관계_에 있는 경우가 많음
- 두 변수가 선형 관계에 있는지 알아보는 법 = 산점도, 상관계수
산점도 : x,y 좌표값으로 나타냄 - 회귀식에서 W와 b를 찾는 방법
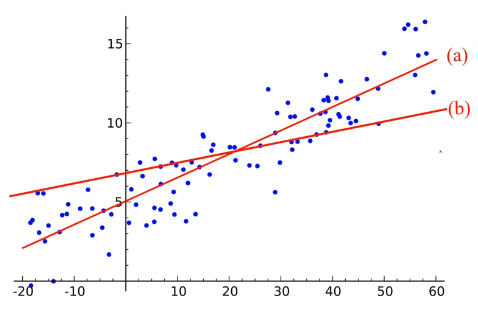
(a)와 (b)중 어떤걸 선택? => 객관적 평가 척도가 필요함
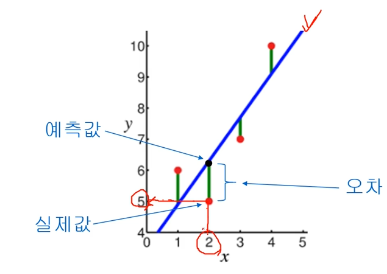
좋은 식은 오차들의 합계가 작은 것임
오차들의 차이 계산? => 오차가 +값, -값이 나오므로 제곱한 값들의 합을 사용함 => 최소 제곱법
Code
# module load
import matplotlib.pyplot as plt
import numpy as np
import pandas as pd

from sklearn.linear_modle import LinearRegression
from sklearn.metrics import mean_wquared_error, r2_score
from sklearn.model_selection import train_test_split
# prepare dataset
cars = pd.read_csv('D:cars.csv')
speed = cars['speed']
distance = cars['distance']
# data frame to npl.numpy => numpy 배열로 바꾸어주어야함
speed = np.array(speed).reshape(50,1)
distance = np.array(distance_.reshape(50,1) # 1차원 벡터가 되어야 하므로 (50,1)로 바꾸어줌 (2차원 벡터로)
# Split the data into training/testing sets
train_X, test_X, train_y, test_y = train_test_split(speed, distance, test_size=0.2, random_state=123)
# 인자 speed = x, distance = y, test_size-0.2 = 전체 개수 중 20%를 테스트로 사용하고 나머지를 trainning으로, random_State = 무엇이 test가 되고 train이 될지 랜덤하게 결정# 학습 방법을 정해줌
model = LinearRegression()
# 학습 시킴
model.fit(train_X, train_Y)
# 예측함(테스트 셋으로 테스트함)
pred_y = model.predict(test_X)
print(pred_y)# 예측
print(model.predict([[13]])- [[]] 괄호 2개를 사용하는 이유는 predict는 배열이 들어가야하는데, 2차원 배열을 만들기 위해서 괄호 2개를 사용함
# W와 b값
print('coef : {0: .2f}, Intercept : {1: .3f}'.format(model.coef_[0][0], model.intercept
_[0]))
(파이썬에서는 format함수를 이용해서 문자열과 변수값을 쉽게 작성할 수 있다. 문자열 안에 {}기호를 작성하고 .format을 붙여 변수를 넣음. print("a={}".format(a)) )
- Model 평가
- The mean squared error
print('Mean squared error: {0: .2f}'.format(mean_squared_error(test_y, pred_y)))
- The coefficient of determination : 1 is perfect prediction
print('%.2f' % r2_score(test_y, pred_y))- 모델 시각화(
plt.scatter(test_X, test_y, color = 'black')
plt.plot(test_X, pred_y, color='blue', linewidth=3)

plt.xlabel('speed')
plt.ylabel('distance')

plt.show()
Multiple linear regression (중선형 회귀)
- 독립변수(설명변수)가 2개 이상인 경우
- 예시
- 키(X1) 몽무게(X2)를 가지고 혈당(Y)를 예측
- 앞의 예시인 자동차의 속도를 가지로 제동거리를 예측할 경우, 단순히 제동거리는 주행속도에 의해 결정이 되진 않음!
- 따라서 다양한 요인을 넣는다면 오차는 줄어들 것임
- 예시 = 특정 직군의 연봉을 교육년수, 여성비율, 평판으로 예측
import pandas as ps
import numpy as np
from sklearn.linear_model import LinearRegression
from skleran.metrics import mean_squared_error, r2_score
from sklearn.model_selection import train_test_split
# load the prestge dataset
df = ps.read_csv('D:prestige.csv')
print(df)
df_x = df[['education', 'women', 'prestige']]
df_y = df[[i'income']]
데이터 셋을 준비하면 test/training set으로 나눔
# split the data into training/testing sets
train_X, test_X, train_y, test_y = train_test_split(df_X, df_y, test_size=0.2)

# Dfine learing model
model = LinearRegression()

# Train the model using the training sets
model.fit(train_X, train_y)

# Make predictions using the testing set
pred_y = model.predict(test_X)
print(pred_y)
learning model은 같지만 내용은 달라짐 = 변수 3개
# The coefficient & intercept
print('cofficients: {0:.2f}, {1:,2f}, {2:.2f} Intercept {3:.3f}'.format(model.coef_[0], model.coef_[1], model.coef[2], model.intercept))

# The mean squared error
print('Mean squared error: {0:.2f}',format(mean_squared_error(test_y, pred_y)))

# The coefficient of determination: 1 is perfect prediction
print('Coefficient of determinaion: %.2f' % r2_score(Test_y, pred_y))
그러면 연봉은 어떻게 구할까? => model.predict 사용
ex) education : 11.44 /women : 8.13 /prestige : 54.1
# Test single data
my_test_x = np.array([11.44, 8.13, 54.1]),reshape(1,-1) #행의 개수는 1, 열은 알아서 맞추어라(주어진 개수대로)
my_pred_y = model.predict(my_test_x) #예측값 얻음
print(my_pred_y)
Logistic regression
- 일반적인 회귀 문제는 종속변수가 수치데이터임
- 범주형 데이터를 예측할때, 회귀방법으로 구할때
- 예시 : iris 데이터셋이에서 4개의 측정 데이터로부터 품종(분류)을 예측
- Logistic 회귀도 y값이 숫자임
from sklearn import datasets #dataset에 iris가 포함되어 잇음
from sklearn.linear_model import LogisticRegression
from sklearn.model_selection import train_test_split
from sklearn.metrics import accuracy_score # 모델 정확도가 오차를 사용하지 못함
# Load the diabetes dataset
iris_X, iris_y = datasets.load_iris(return_X_y=True) # 독립변수와 종속변수를 구분해서 가져옴
print(iris_X.shape)
# Split the data into training/testing sets
train_X, test_X, train_y, test_y = train_test_split(iris_X, iris_y, test_size=0.3, random_state=1234)
# Define learning model
model = LogisticRegression()

# Train the model using the training sets
model.fit(train_X, train_y)

# Make predictions using the testing set
pred_y = model.predict(test_X)
print(pred_y)

# model evaluation: accuracy #############
acc = accuracy_score(test_y, pred_y)
print('Accuracy : {0:3f}'.format(acc))
Accuracy = 예측과 정답이 일치하는 instance 수 / 전체 test instance 수
! 종속변수가 숫자여야하기 때문에 문자형으로 되어 있는 범주 데이터를 숫자로 변환해야됨 => LabelEncoder
from sklearn.preprocessing import LabelEncoder
import numpy as np
number = LabelEncoder() # 객체생성

label_str = np.array(['M','F','M','F','M'])
label_num = number.fit_transform(label_str).astype('int') # int로 바꾸어라 기준은 알파벳 순서대로 F =0, M = 1
print(label_str)
print(label_num)
728x90
반응형
'공부 > 딥러닝' 카테고리의 다른 글
| CIFAR-10 의 레이블중 하나를 예측 (0) | 2021.05.09 |
|---|---|
| classification 경진대회 (0) | 2021.05.03 |
| 딥러닝 4 (0) | 2020.10.29 |
| 딥러닝 3 (0) | 2020.10.09 |
| 딥러닝 2 (0) | 2020.09.29 |

아상관없어